What Makes a Deviate Standard?
Actually it’s a standard deviation. And it is one of two commonly used measures of dispersion. The other is the range.
The last two articles discussed measures of central tendency as descriptors for a distribution of numbers, such as sales figures. Measures of central tendency are averages around which the distribution of values tend to cluster.
The other key descriptor of a distribution of numbers is how the numbers are spread out or dispersed from whichever average you use.
By far the easier of the two major measures of dispersion to use and to calculate is the range. The range is simply the lowest and highest values in the distribution. Sometimes a range is divided into percentiles such as halves, thirds, quarters, etc. So you may refer, respectively, to the bottom 50 percent, the middle 33 percent, the top 25 percent, and so on.
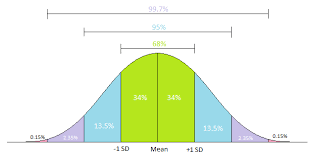
In some distributions, rectangular ones for instance, a range or range by percentiles is very useful. A rectangular distribution is a distribution where each value shows up about the same number of times, so averages don’t mean as much as say in a bell curve.
The other key measure of dispersion is the standard deviation.
One obvious way to measure dispersion is taking the difference between each value in a distribution and that distribution’s arithmetic mean. Then add each of these differences.
You ask isn’t that going to wash out because some differences are positive and some negative?
Yup! So what you do is:
First, square each of the differences. That gets rid of the negatives. However, it also greatly increases the total spread. We’ll fix that in a minute.
Second, add up each of those squared differences.
Third, divide that total of squared differences by the number of values, which gives the arithmetic mean of the sum of the squared differences.
Fourth, take the square root of the arithmetic mean of the sum of the squared differences. This square root is called the standard deviation. Besides fixing the increase caused by the squaring, it has a lot of uses in market research and other statistical stuff.
Alas, you now know how to standardize a deviate.
The number you are taking the square root of is called the variance and that also has some important uses in market research and statistics.